crlfutia预测黄金到850,原油到77,美国股市SP500是1963-1800点。
|
| 2014-06-06, 9:02 PM |
Here are three long term, monthly charts which offer some perspective on the longer term potential in the gold, silver, and crude oil markets.
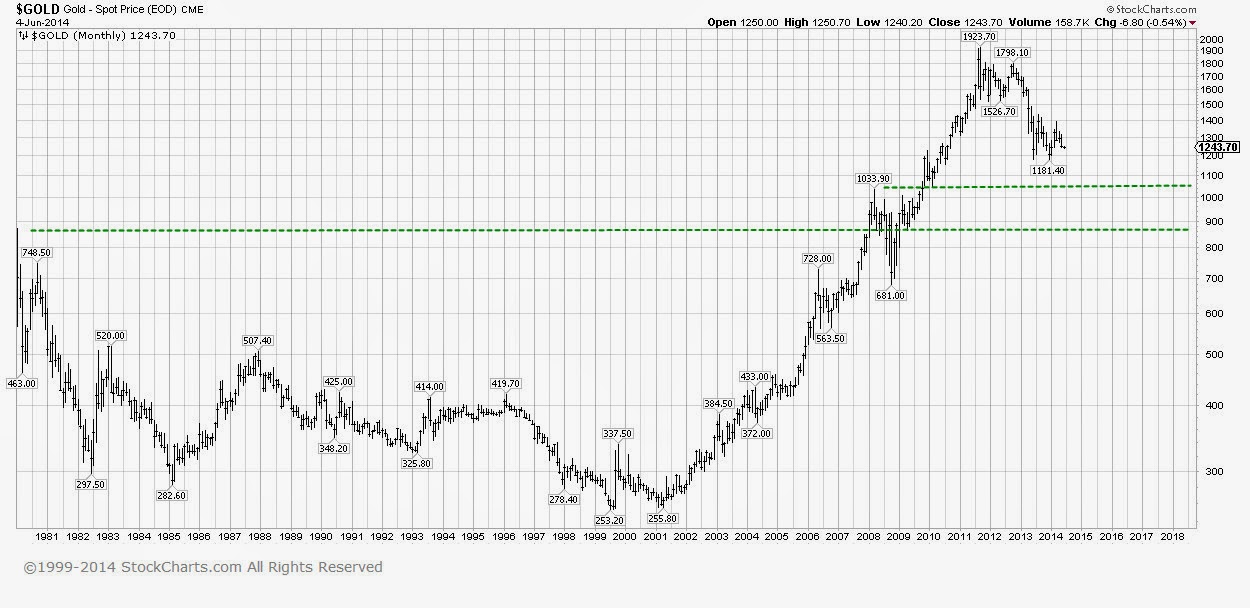
The top chart is a monthly chart of of gold going back to its last big top in January 1980 at 874 in futures and 850 in the London fix. What I find interesting about gold is the fact that the market has been dropping since the European panic high at 1923 in 2011. This has happened despite an aggressive quantitative easing program by the Fed and the Bank of Japan during the previous 30 months. A bearish gold market during a period of monetary stimulus suggests to me that the market's 2011 high was more about safety during a financial panic than about real or anticipated inflation. Since a financial panic is unlikely while central bands are willing to adopt QE policies to prevent it (the European central bank started to move in that direction today) I think gold's current bear market will continue as will silver's.
I think gold will probably drop back to its 850-874 top established in 1980 which now is likely to act as support beneath the market. That zone is just a bit below the .681 retracement of the 1998-2011 bull market as well. A secondary but more optimistic target is support at the 1034 high which was established early in 2008.
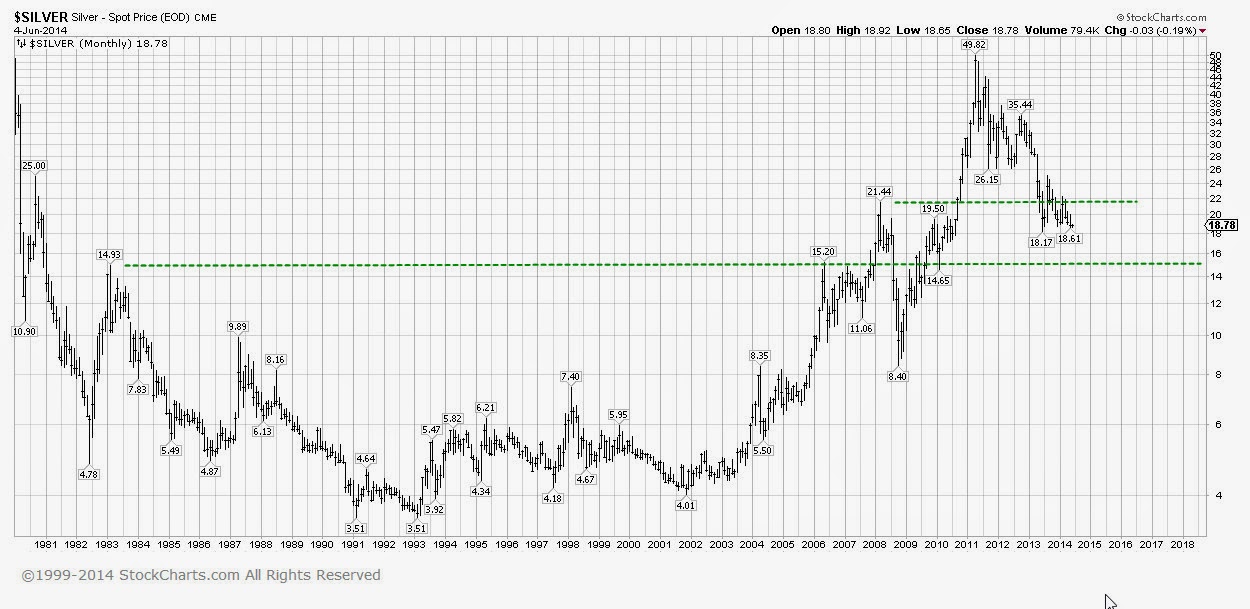
I expect silver to drop to support in the $14-15 zone which corresponds to its 1983 top.
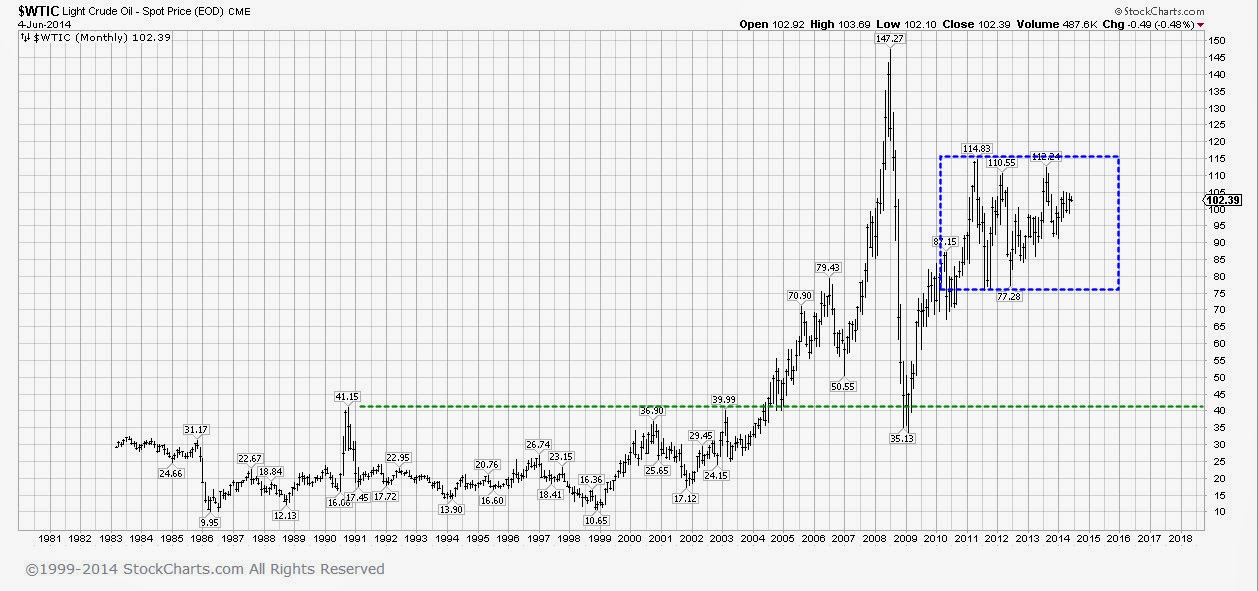
Crude oil is more of puzzle to me. The market dropped from 147 to 35 in the face of the 2008 financial crisis. It then rallied $80 but for the subsequent three years has remained in a trading range between 77 and 114. I think crude will return at least to the low of this trading range. I'd also say if such a drop were to carry crude visibly below 77 then a return the support in the 35-40 zone would become likely.
I have nothing new to say about the US stock market. The intermediate and long term trends both are upward and and both the Dow and the S&P remain well above their 50 day moving averages. My long standing upside target for the S&P is 1963. My Lindsay calculations point to July 2014 as the likely time for a high of some consequence. I suspect that the next drop in the averages will take them down to or below their 200 day moving averages which currently stand at 15,963 in the Dow and at 1801 in the S&P. Any bigger drop than that would herald the start of a bear market which would take the averages down 20-30 % from their highs.
|
|
分类:: 预测(509)
|


